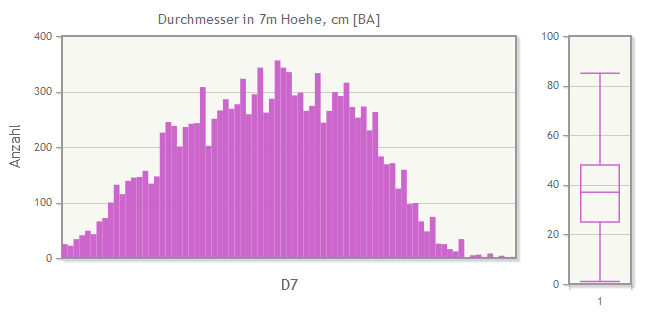
For work I needed a way to show boxplots (see diagram to the right) using the jqPlot library. All I had to do was override the draw() method of OHLCRenderer (see code below).
Update 13.10.2017: Upon request I created a working demo of the BoxplotRenderer using some helper classes to setup jqPlot charts from another project.
define(['/library/jqplot/plugins/jqplot.ohlcRenderer.min.js'], function() {

	return function() {

		/**
		 * @module BoxplotRenderer
		 */
		$.jqplot.OHLCRenderer.prototype.draw = function(ctx, gd, options) {
			var d = this.data, dinterval,
			xmin = this._xaxis.min,
			xmax = this._xaxis.max,
			xminidx = 0,	// index of last value below range of plot.
			xmaxidx = d.length,	// index of first value above range of plot.
			xp = this._xaxis.series_u2p,
			yp = this._yaxis.series_u2p,
			ops, b, h, w, a, l, median, points,
			i, o, r = this.renderer,
			opts = (options !== undefined) ? options: {};

			r.bodyWidth = (opts.bodyWidth !== undefined) ? opts.bodyWidth: r.bodyWidth;
			r.tickLength = (opts.tickLength !== undefined) ? opts.tickLength: r.tickLength;
			ctx.save();
			if (this.show) {
				var x, open, hi, low, close;
				// need to get widths based on number of points shown,
				// not on total number of points.  Use the results
				// to speed up drawing in next step.
				for (i = 0; i < d.length; i++) {
					if (d[i][0] < xmin) {
						xminidx = i;
					}
					else if (d[i][0] < xmax) {
						xmaxidx = i + 1;
					}
				}

				var dwidth = this.gridData[xmaxidx - 1][0] - this.gridData[xminidx][0];
				var nvisiblePoints = xmaxidx - xminidx;
				try {
					dinterval = Math.abs(this._xaxis.series_u2p(
						parseInt(this._xaxis._intervalStats[0].sortedIntervals[0].interval, 10)
					) - this._xaxis.series_u2p(0));
				}

				catch(e) {
					dinterval = dwidth / nvisiblePoints;
				}


				if (typeof(r.bodyWidth) === 'number') {
					r._bodyWidth = r.bodyWidth;
				}
				else {
					r._bodyWidth = Math.min(20, dinterval / 1.65);
				}


				for (i = xminidx; i < xmaxidx; i++) {
					x = xp(d[i][0]);

					// 25%, max, min, 75%
					open = yp(d[i][1]);
					hi = yp(d[i][2]);
					low = yp(d[i][3]);
					close = yp(d[i][4]);
					median = yp(d[i][5]);

					o = {};

					w = r._bodyWidth;
					a = x - w / 2;

					// draw candle
					// Remember: grid coordinates increase downward

					if (r.wickColor) {
						o.color = r.wickColor;
					}
					else if (r.downBodyColor) {
						o.color = r.upBodyColor;
					}
					ops = $.extend(true, {}, opts, o);

					// line from box to max
					r.shapeRenderer.draw(ctx, [
						[x, hi],
						[x, close]
					], ops);

					// line from box to min
					r.shapeRenderer.draw(ctx, [
						[x, open],
						[x, low]
					], ops);
					o = {};
					b = close;
					h = open - close;
					// if color specified, use it
					if (r.fillUpBody) {
						o.fillRect = true;
					}
					else {
						o.strokeRect = true;
						w = w - this.lineWidth;
						a = x - w / 2;
					}

					// max
					l = x + w / 2;
					r.shapeRenderer.draw(ctx, [
						[a, hi],
						[l, hi]
					], ops);

					// min
					r.shapeRenderer.draw(ctx, [
						[a, low],
						[l, low]
					], ops);

					// median
					r.shapeRenderer.draw(ctx, [
						[a, median],
						[l, median]
					], ops);

					if (r.upBodyColor) {
						o.color = r.upBodyColor;
						o.fillStyle = r.upBodyColor;
					}

					// draw box
					points = [a, b, w, h];
					ops = $.extend(true, {}, opts, o);
					r.shapeRenderer.draw(ctx, points, ops);
				}
			}

			ctx.restore();
		};

		return new $.jqplot.OHLCRenderer;
	};
});
Dear Simon
Can you please send me one complete example of generating box plot using this plugin.
Thanks in Advance
Shiv Nath
Hi Shiv
I’m sorry, but I’m currently in the Australian bush for two months and will not have time to give you a complete example until I’m back in November. But the code uses the dojo toolkits define() function to create an AMD module, which overrides the draw method. If that doesn’t tell you anything, then you can also just simply search for the draw method in the file hlcRenderer.js and replace it with the code given. Good luck.
Simon
Can you provide with an example now?
I created a working example of the BoxplotRenderer.